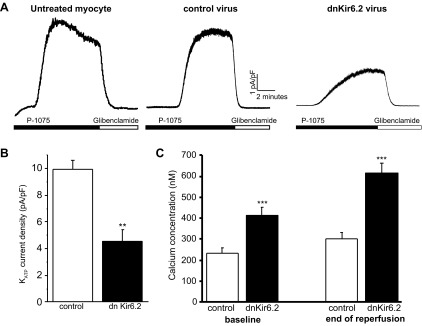
Fig. 4.

Effect of expression of dominant negative (dn)Kir6.2 on KATP current density and Ca2+ homeostasis. A: whole cell recordings of KATP currents from isolated ventricular myocytes after 24 h either untreated or infected with adenovirus expressing control green fluorescent protein (GFP) or dnKir6.2. Currents were recorded at 0 mV, and P1075 (10 μM) and glibenclamide (10 μM) were bath applied, as indicated by the horizontal bars. B: difference in peak KATP currents normalized for cell size (in pA/pF) of myocytes infected with control GFP adenovirus (n = 5) or dnKir6.2 adenovirus (n = 6). **P < 0.01 vs. control. C: mean estimated [Ca2+]i recorded in normal Tyrode solution before MI solution (baseline) and after 10 min of reperfusion (end of reperfusion) for myocytes infected with control GFP adenovirus (n = 23, 4 experiments) or dnKir6.2 adenovirus (n = 33, 4 experiments). ***P < 0.001 vs. control.
