Fig. 5.
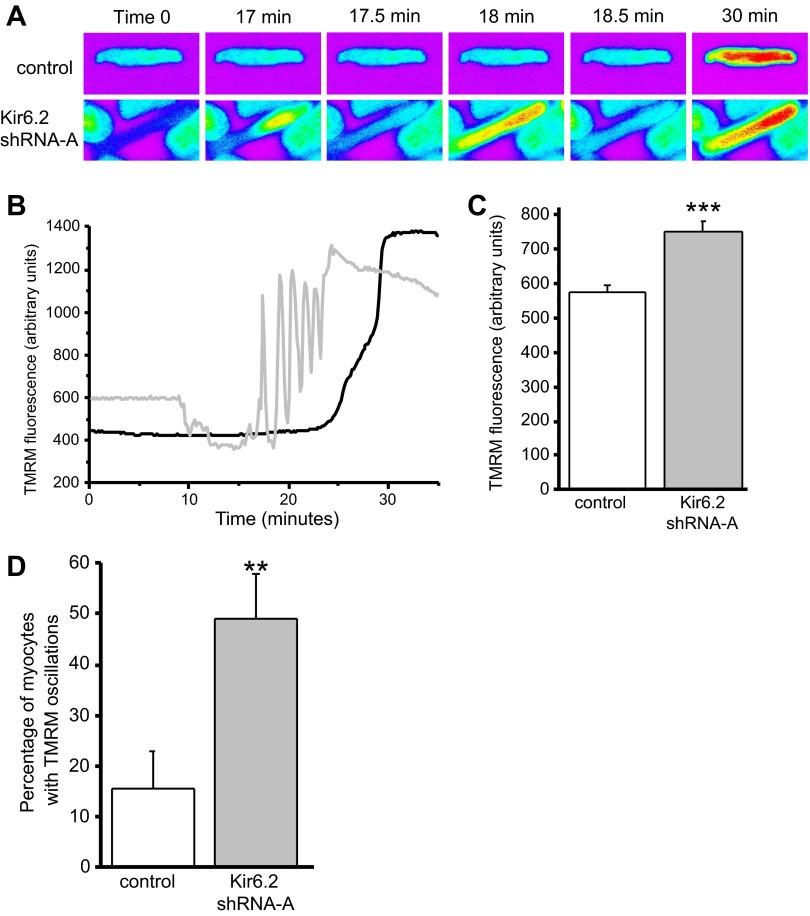
Changes in mitochondrial membrane potential of myocytes infected with control or Kir6.2 shRNA-A adenovirus. A: example time series showing fluorescence images of representative ventricular myocytes loaded with 5 μM tertramethylrhodamine methyl ester (TMRM) subjected to laser-induced oxidative stress. Time 0 is before oxidative stress. Mitochondrial depolarization is indicated by the increase in the intensity of fluorescence (increase in warm colors, e.g., red indicating the highest and blue the lowest fluorescence intensity). B: typical TMRM fluorescence intensity traces (in arbitrary units) recorded from myocytes infected with control (solid line) or Kir6.2 shRNA-A (shaded line) adenovirus for 24 h. C: baseline TMRM fluorescence (in arbitrary units) recorded at the beginning of the experiment from myocytes infected with control (n = 157) and Kir6.2 shRNA-A (n = 174) for 24 h. ***P < 0.001. D: percentage of myocytes that displayed mitochondrial membrane potential oscillations before the final depolarization for myocytes infected with control adenovirus (n = 77 myocytes, 20 experiments) compared with myocytes infected with Kir6.2 shRNA-A (n = 84 myocytes, 19 experiments) for 24 h. **P < 0.01.

