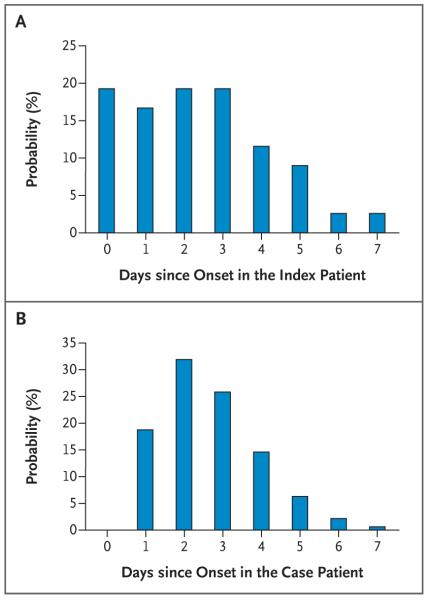
Figure 2. Serial Interval of 2009 H1N1 Influenza.
Panel A shows the observed probability that symptoms of acute respiratory illness will develop in a household member, according to the number of days after the onset of symptoms in the index patient. Household members in whom symptoms developed on the same day that symptoms developed in the index patient (i.e., 0 days since onset in the index patient) are termed coprimary case patients. Panel B shows the distribution of the serial interval (i.e., the interval between the onset of symptoms in a case patient and the onset of symptoms in the household contacts infected by that patient). This interval was estimated with the transmission model, which adjusted for tertiary infections, community infections, and censoring of the data. The estimated distribution is based on the assumption that the minimum time between the onset of symptoms in a case patient and the onset of symptoms in household contacts infected by that patient was 1 day.

