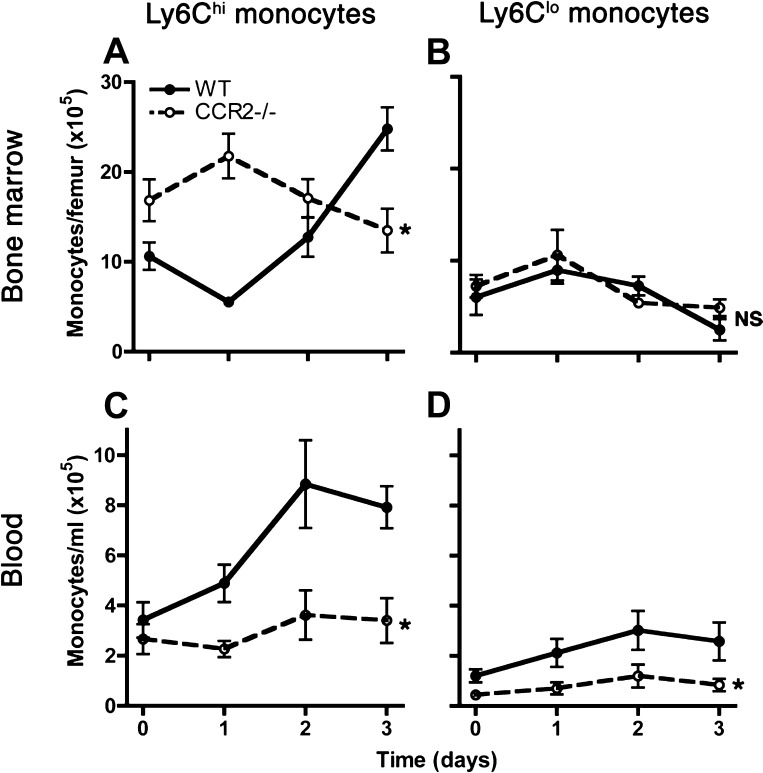
Fig. 5.
Comparison of blood and bone marrow monocyte kinetics between wild-type and CCR2-deficient mice with experimental Gram-negative pneumonia. Number of bone marrow (A and B) and concentration of blood (C and D) monocytes, defined as noted in Fig. 2, are shown at various times after intrapulmonary challenge with Klebsiella. Day 0 represents uninfected mice. Data shown represent means ± SE of representative data from 3 experiments; n = 4–5 for each group at each time point. *P < 0.05 comparing trend between the 2 groups over time; NS, no significant difference (2-way ANOVA).

