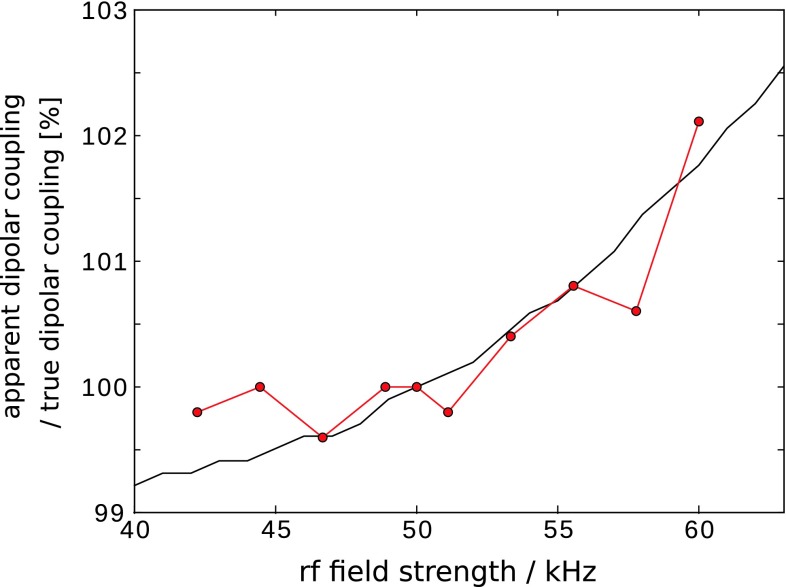
Fig. 4.
Dependence of the apparent dipolar coupling on the rf field strength of the central 15N π pulse in the REDOR experiment of Fig. 3a. The experimental data (red) were obtained from 1D REDOR curves in an analogous manner as the data shown in Fig. 3c,d. Different points reflect different rf power level settings. Experimentally, the 15N π pulse was calibrated by setting the pulse with phase Φ3 (Fig. 3a) to 10 μs, and searching the rf power that results in zero intensity, analogous to the procedure in b. The point at 50 kHz was set according to this calibration. The black solid curve shows simulated data. REDOR experiments were simulated by assuming a H-N dipolar coupling of 20.4 kHz, and perfect 100 kHz (5 μs) 1H π pulses and 15N π pulses of 10 μs duration and variable field strength. Remote protons and rf field distribution were ignored. The simulations were fitted against ideal two-spin simulations, and the resulting dipolar coupling is reported (relative to the nominal 20.4 kHz value). The red curve was set in the vertical axis such that 100 % is at an rf field of 50 kHz. The black curve is normalized to the nominal input value of δD = 20.4 kHz

