
Figure 6.
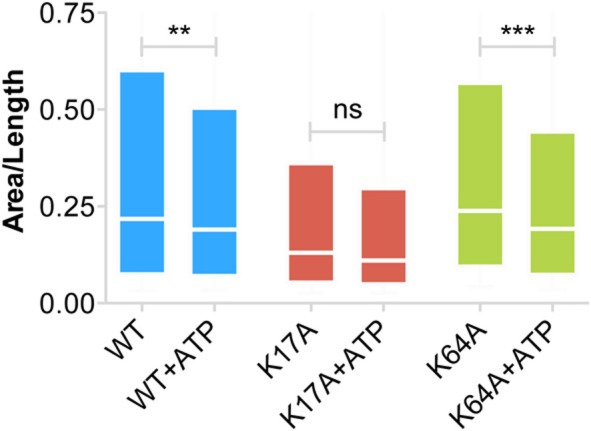
Increased confinement of P2X7Rs trapped within nanoclusters. Area (pixels) per unit length of trajectory (number of steps) provides a good estimate of the area explored by trajectories and thus the size of the confinement domain. WT- and K64A-PX7Rs “trapped” within nanoclusters showed a reduction in the area explored or increased confinement in the presence of ATP. Graph shows a distribution from 25th percentile to 75th percentile. (Kolmogorov-Smirnov test. ***p < 0.001, **p < 0.01, ns, no significant difference).