
Fig. 4.
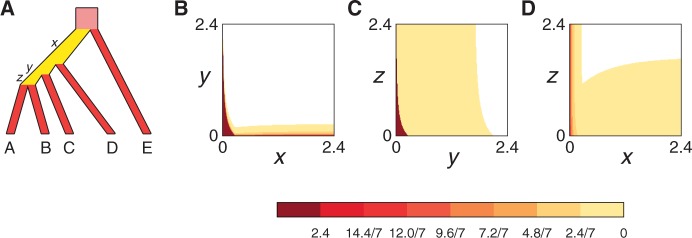
An example of the role of consecutive branches in production of AGTs. (A) A five-taxon caterpillar labeled topology ψ with internal branches of length x, y, and z. (B–D) Sections of the anomaly zone. In each panel, for two of the three variables x, y, and z, a point is shaded according to the largest value of the third variable for which AGTs occur. The color bar indicates the values of this third variable, with the darkest shade corresponding to a value ≥2.4. At some points, AGTs can occur when this variable is arbitrarily large. The figure was constructed by evaluating the equations in supplementary tables 16–18 of Rosenberg and Tao (2008) at a grid of points with  , each examined at intervals of 0.012.