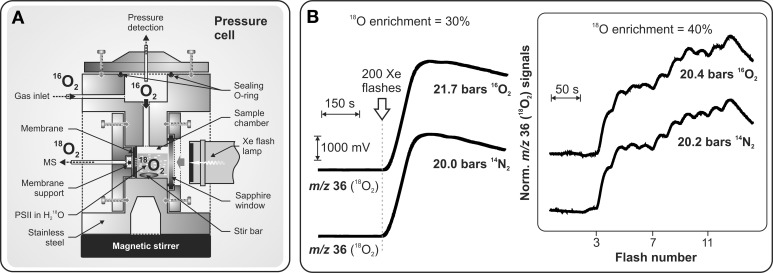
Figure 5.
Schematic representation of the pressure cell (A) specially designed for TR-MIMS measurements of light-induced 18O2 evolution of PSII under high 16O2/N2 pressures (up to 20 bars). (B) MIMS signals in panel (B); Left: 18O2 production of PSII core complexes from Synechocystis sp. PCC 6803 induced by a series of 200 saturating Xenon flashes (given at 2 Hz; indicated by arrow) at 21.7 bars O2, or 20 bars N2. Other conditions: 30% H182O enrichment; [Chl] = 50 μM; 250 μM DCBQ, pH 6.7, 20°C. Right: Flash-induced 18O2 evolution patterns of PSII membrane fragments from spinach induced by a series of saturating laser flashes (separated by dark times of 25 s) at 20.4 bars O2, or 20.2 bars N2. Other conditions: as above, but with 40% H182O. Adapted from Shevela et al. (2011a).

