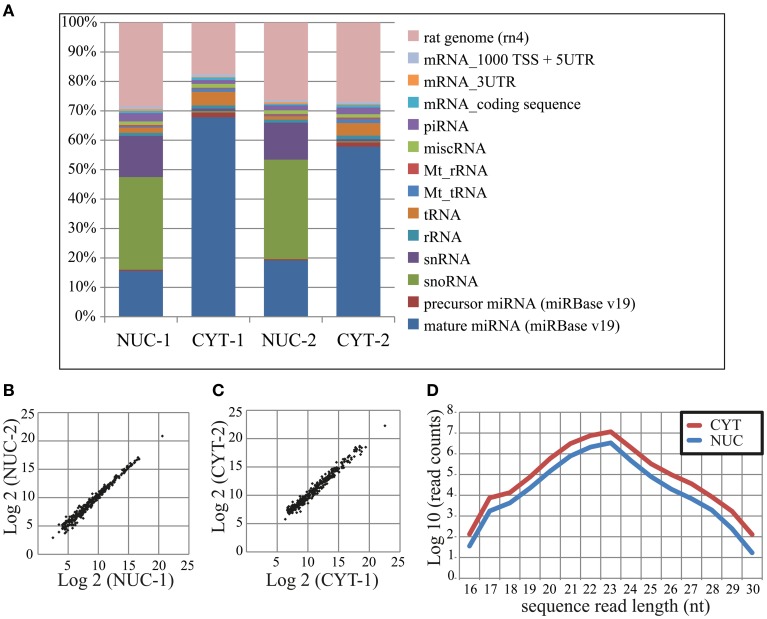
Figure 2.
Small RNA deep sequencing after nucleo-cytoplasmic fractionation of neurons. (A) Proportional distribution of mapped sequencing read counts in the small RNA libraries. The total read counts were set to 100% for each small RNA library. (B,C) Scatterplots of log2 transformed read counts mapping to mature miRNAs from the nuclear (B) and cytoplasmic (C) fractions (two biological replicates each). (D) The sequence length distribution (x-axis) of reads mapping to mature miRNAs. The read counts (y-axis) were log10 transformed.

