Figure 5.
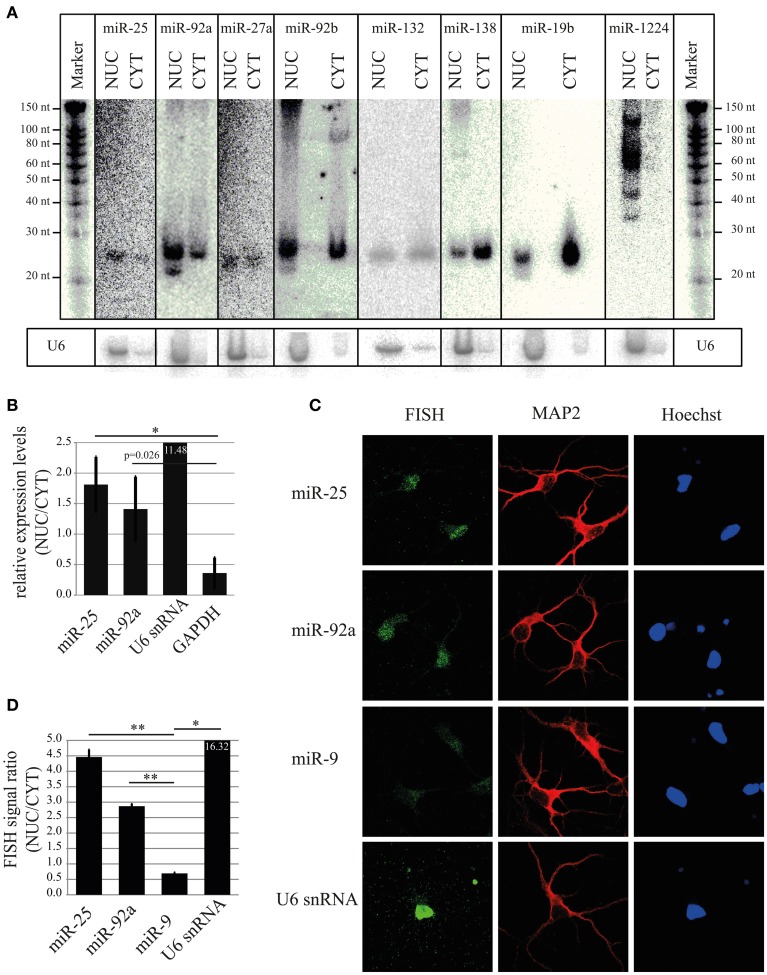
Validation of nuclear expression for selected miRNA candidates. (A) Northern blot analysis of nuclear-enriched (miR-25, miR-92a, miR-27a, miR-92b) and -depleted miRNAs (miR-138, miR-19b). As a control for the fractionation efficacy, U6 snRNA was probed. (B) qRT-PCR analysis of nuclear-enriched miRNAs (miR-25 and miR-92a). The fold enrichment (y-axis) of miRNAs and marker genes (U6 snRNA and GAPDH) in the nucleus was calculated by the 2−dCt [2−(NUC Ct−CYT Ct)] method. Bar plots show mean ± SD (n = 3). Statistical significance was determined using Student's t-test with Bonferroni correction (*p < 0.05). (C) Subcellular localization of the indicated miRNAs at DIV5 hippocampal neurons as assessed by fluorescent in situ hybridization assay (FISH) using Digoxigenin (DIG) labeled miRCURY LNA probes (green). FISH for U6 was used as a positive control for nuclear localization. MAP2 protein was used to identify neurons (red). Hoechst counterstain was used to label nuclei (blue). (D) Quantification of nuclear localization from FISH experiment presented in (C). Signal intensities within the nucleus and cytoplasm were determined with ImageJ. The ratios of nuclear/cytoplasmic signal intensities are shown as an indicator for nuclear enrichment. Bar plots show mean ± SD (n = 2; 10 cells per condition of a single experiment). Statistical significance was determined using Student's t-test with Bonferroni correction (*p < 0.05; **p < 0.01).

