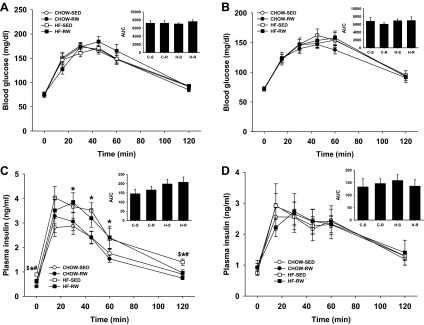
Fig. 4.

Glucose tolerance test (2.0 g/kg, oral gavage) at 7 wk (right after 3 wk running) (A and C) and 10 wk (sedentary for 3 wk after running) (B and D) of age. Blood glucose (A and B) and plasma insulin (C and D) were determined for 2 h after administration of glucose. The integrated area under the curve (AUC) was determined for glucose and insulin using the trapezoidal method. *Main effect of maternal HF diet, P < 0.05 vs. maternal CHOW diet. #Main effect of running, P < 0.05 vs. sedentary group. $P < 0.05, HF-SED vs. other three groups. C-S, CHOW-SED; C-R, CHOW-RW; H-S, HF-SED; H-R, HF-RW.
