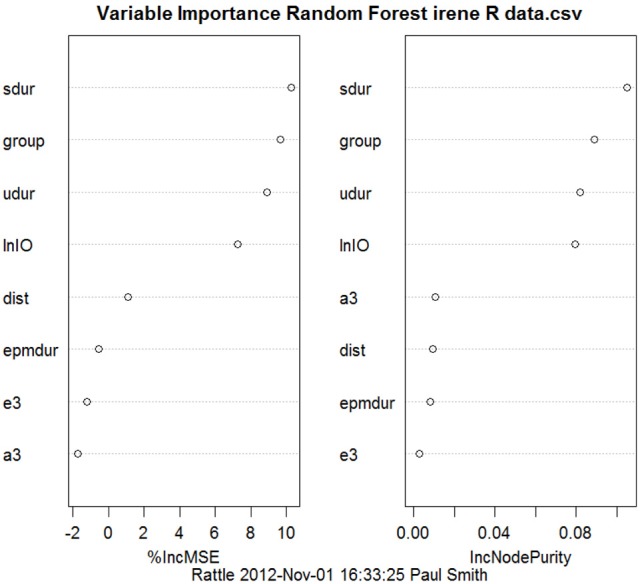
Figure 8.

Random forest regression, showing variables in order of importance from the top to the bottom, to predict the performance of BVD and sham animals in a spatial T maze task from the animals' performance in other behavioral tasks, such as the elevated plus maze, the open field maze and the elevated T maze. “group:” whether the animals had received a BVD or a sham operation. “epmdur:” duration of open arm entries in the elevated plus maze. “lnIO:” the ln of the ratio of time spent in the inner/middle to the outer zones of the open field maze. “e3:” 3rd escape latency in the elevated T maze. “a3:” 3rd avoidance latency in the elevated T maze. “dist:” distance traveled in the open field maze. “sdur:” duration of supported rearing in the open field maze. “udur:” duration of unsupported rearing in the open field maze. Reproduced with permission from Smith et al. (2013).
