Figure 3.
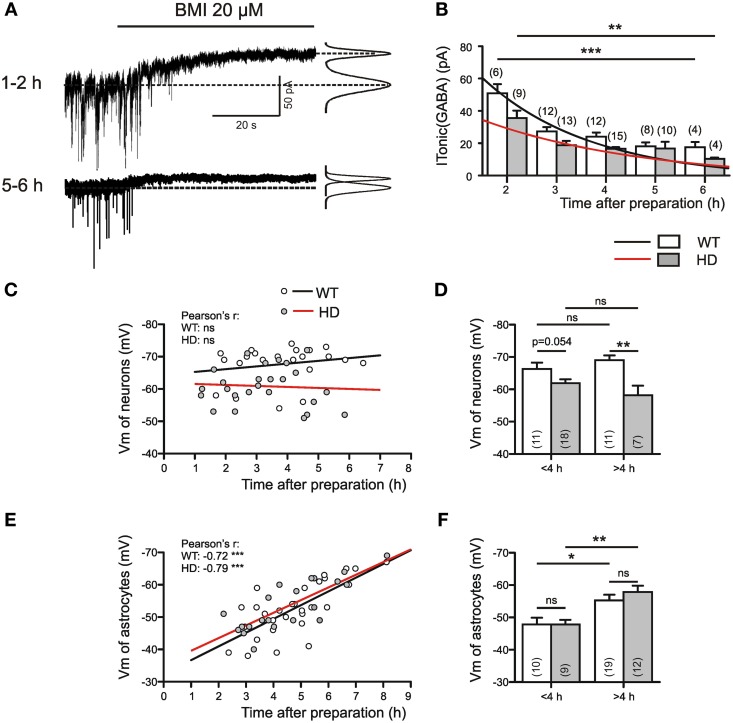
ITonic(GABA) in WT and Q175 HOMs at different times after slice preparation. (A) Sample traces from 2 different WT SONs from the Q175 colony; age: 55 weeks. Experiment in the presence of DNQX (10 μM), APV (50 μM), LY341495 (40 μM); no K channel block; Vh = −70 mV, ECl = 4 mV. On the right: Gaussian fits to all-points histograms derived from 30 s recording periods under control conditions and in the presence of BMI. The difference between the peaks of the fitting curves represents the amplitude of ITonic(GABA) as plotted in (B). (B) Average values of ITonic(GABA) obtained from WT (empty bars) and Q175 HD (filled bars) at variable time after preparation. The differences between 2 and 6 h values were significant for WT at p = 0.0007 and for HD at p = 0.005 (Mann–Whitney test). (C,D) Plots of neuronal membrane potential against time in vitro. Note absence of time-dependency in WT or HD (C), but significantly lower average membrane potentials in the >4 h HD group. (E,F) Plots of astrocytic membrane potentials against time in vitro. Note that with time astrocytic membrane potentials shift toward more negative values (E), without any difference between WT and HD (F). The significance levels in (D,F) refer to Mann–Whitney tests. The asterisks denote the following: *p < 0.05, **p < 0.01, and ***p < 0.001.

