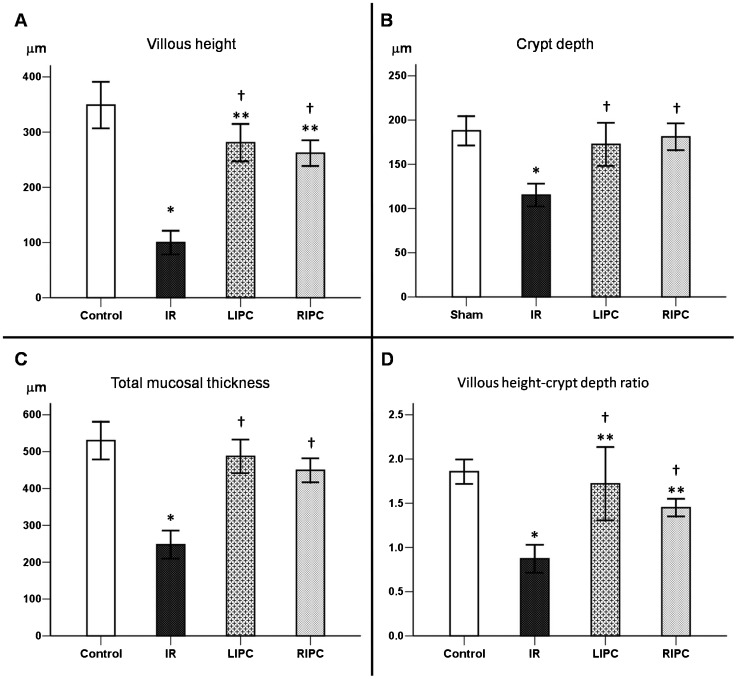
Figure 2.
Histomorphometric analysis of the small bowel demonstrating villous height (A), crypt depth (B), total mucosal thickness (C), and villous height-crypt depth ratio (D) in the control, ischemia and reperfusion (IR), local ischemic preconditioning (LIPC), and remote ischemic preconditioning (RIPC) groups. Data are expressed as the mean ± SE for 7 animals per group. (*) p<0.001: IR vs. control, (**) p<0.05: LIPC and RIPC vs. control, (†) p<0.001: LIPC and RIPC vs. IR.

