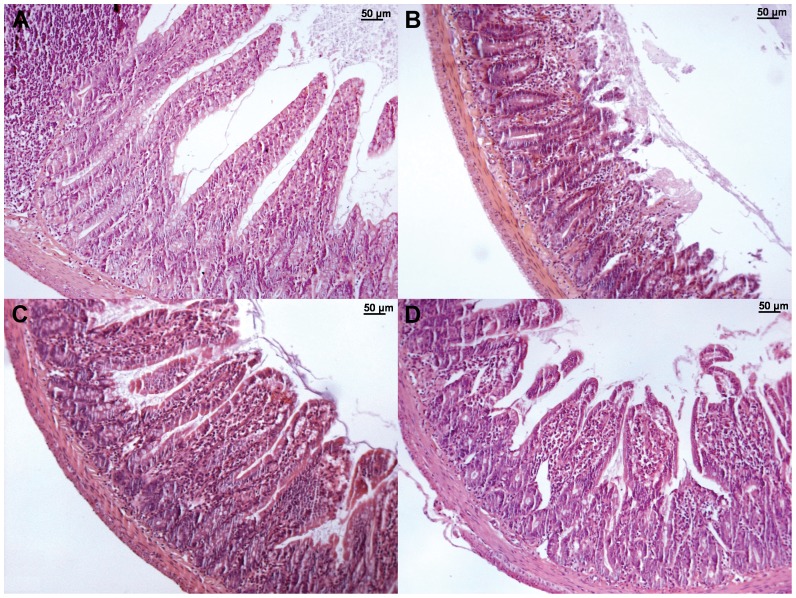
Figure 3.
Representative photomicrographs of the small bowel (HE, x100) from the control (A), IR (B), LIPC (C), and RIPC (D) groups. Normal small intestine architecture is shown in the control group (A). The IR group (B) demonstrates a marked loss of villus height, while the LIPC (C) and RIPC (D) groups have less intense findings.

