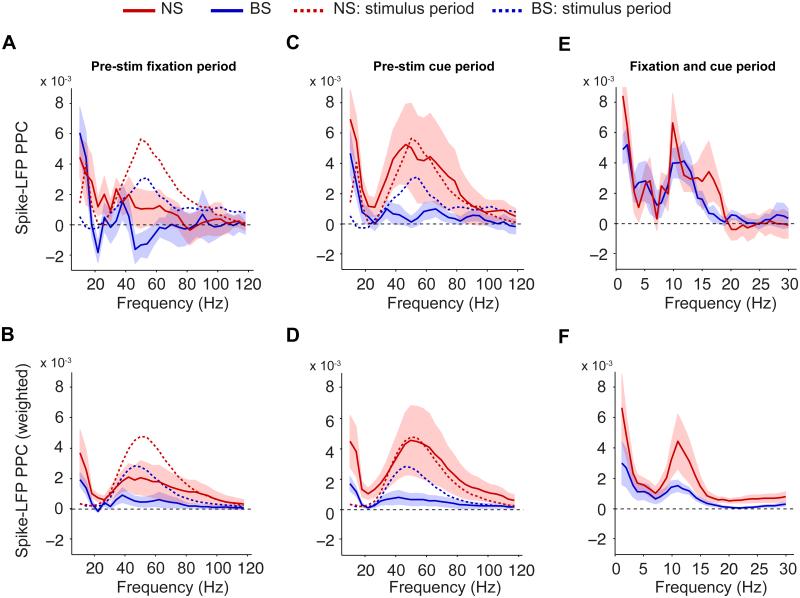
Fig 2. Precision of pre-stimulus phase locking.
(A) Average spike-LFP PPC spectra for the pre-stimulus fixation period. Dashed lines indicate average PPC for sustained stimulus period. (B) Same as (A), but now shown the weighted PPC group average, with the relative weight of a unit proportional to its spike count. (C) Same as (A), but now for the cue period. (D) Same as (B), but now for cue period. (E) Same as (A and C), but now for the complete pre-stimulus period (fixation onset to stimulus onset) and low frequencies. (F) Same as (B and D), but now for complete pre-stimulus period and low frequencies. (A-F) Shadings indicate SEMs. See Fig S1, S3 and S4.

