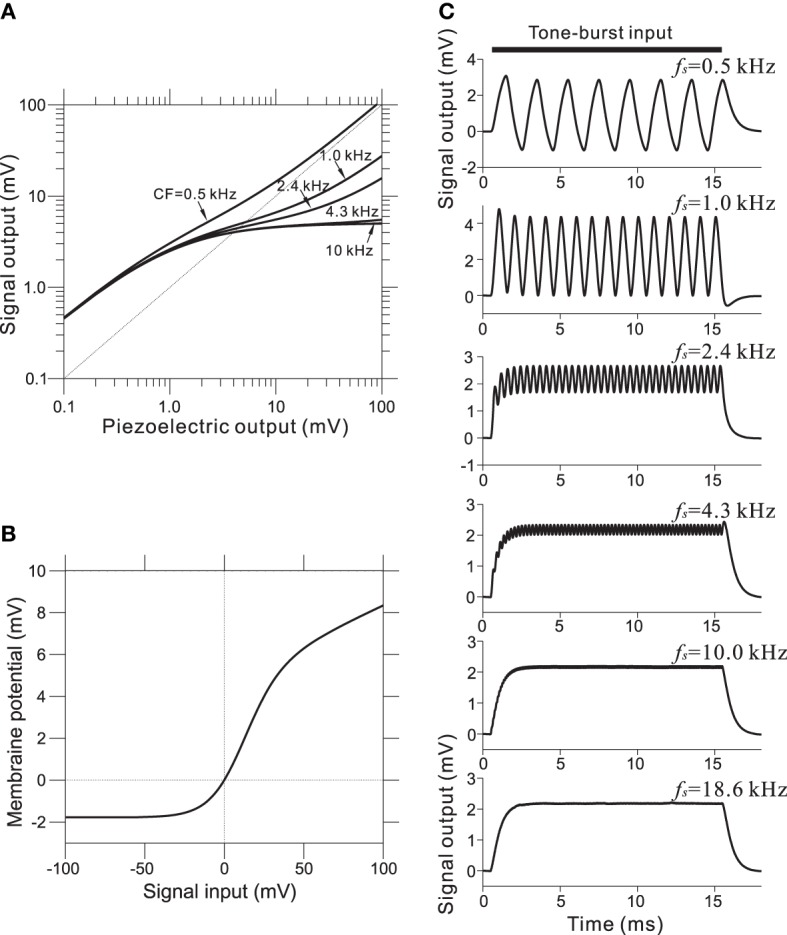
Figure 4.

(A) Compressive effects of the BM were mimicked using CF-dependent non-linear functions. Each relationship depends on the corresponding CF of the BM site. (B) Asymmetrical relationships between input signals (compressive output of the piezoelectric sensor) and the output signal for the IHC model. (C) Intracellular voltage from the IHC model in response to pure-tone bursts. The duration of each pure-tone burst was 15 ms, as indicated by a thick line on the top of graphs, and the amplitude of stimulation was 4.0 mV. The LRF (fs) of the piezoelectric membrane where each model IHC was located is indicated on the upper right of the corresponding trace of the model waveforms.
