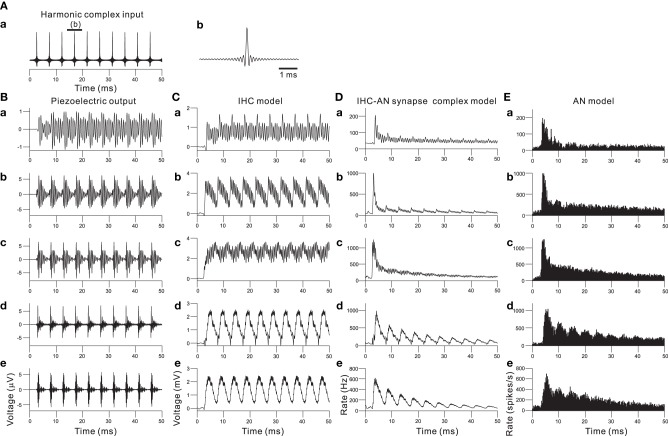
Figure 7.
(A) Input signal of a 210-Hz harmonic complex sound. The peak SBL was 95 dB. (A.b) shows an expanded view of the input signal for the interval indicated by the thick bar on the top of (A.a). (B) In response to the harmonic complex input, piezoelectric output waveforms from the acoustic sensors at Ch. 62, 48, 34, 12, and 2 are shown in (B.a), (B.b), (B.c), (B.d), and (B.e), respectively. For Ch. 2, 12, 34, 48, and 62, the CFs are 1.0, 2.4, 4.3, 10.0, and 18.6 kHz, respectively. (C) Output waveforms from the IHC model. (C.a), (C.b), (C.c), (C.d), and (C.e) correspond to the description in (B); lower frequency to higher frequency sections are shown from the top to the bottom. (D) Responses of the IHC-AN synapse model. The arrangement of the sections is the same as described for (C). (E) Responses of the AN fiber model. The arrangement of the sections is the same as described for (C) and (D).

