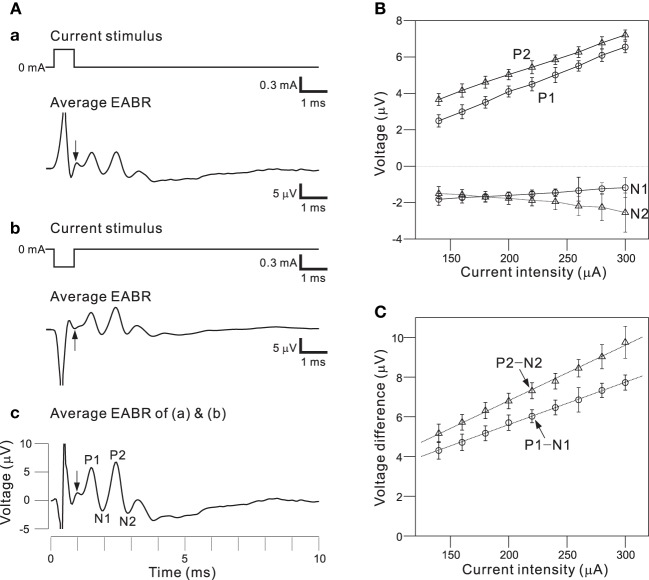
Figure 8.
(A) Averaged EABRs induced by 0.6-ms (A.a) positive (300 μA) current pulses and (A.b) negative (−300 μA) current pulses. Each trace represents an average of 500 responses. A trace representing the average of all 1000 responses is shown in (A.c). In the waveform, positive and negative peak amplitudes are sequentially labeled P1, N1, P2, and N2. The offset times of the stimuli are indicated by arrows. (B) Relationships between peak amplitudes (P1, N1, P2, and N2) and intensities of current pulses. (C) Relationships between peak-to-peak amplitudes (P1-N1 and P2-N2) and intensities of current pulses. Regression lines for the peak-to-peak amplitudes are denoted with dotted lines.

