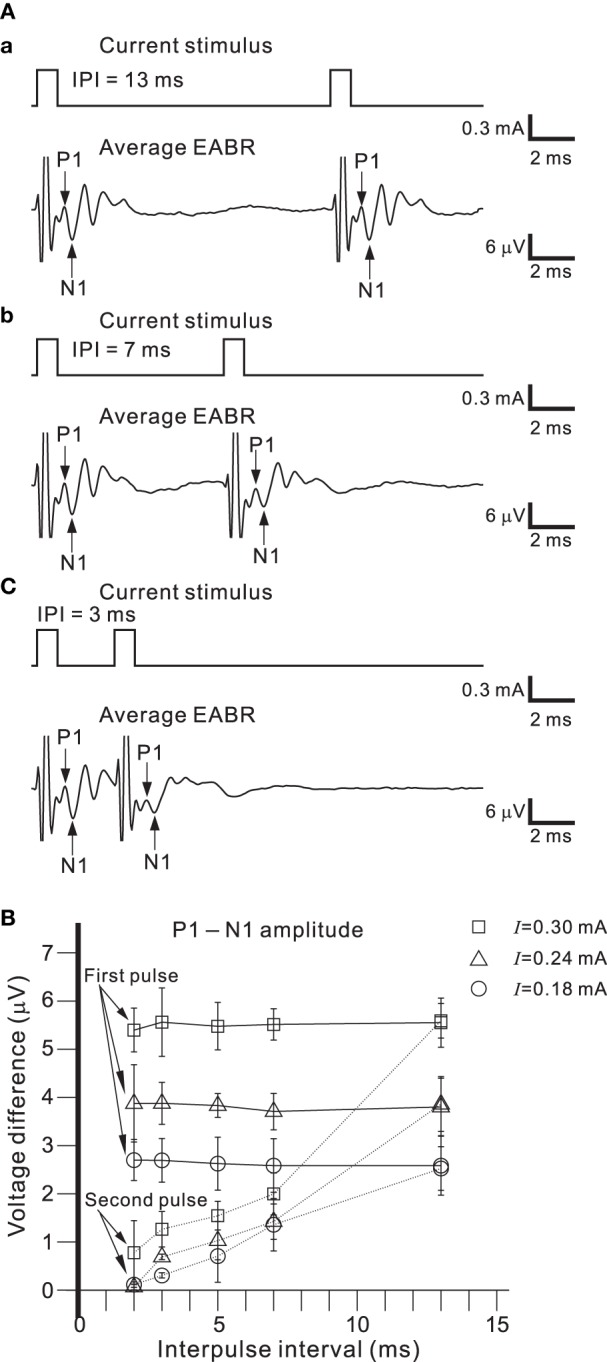
Figure 9.

(A) Averaged EABRs induced by double current pulses with a duration of 0.6 ms and an intensity of 300 μA. The IPI was 13, 7, and 3 ms in (A.a), (A.b), and (A.c), respectively. Although positive and negative pulse stimuli were alternatively applied in the experiment, only the results for a positive pulse stimulus are illustrated. (B) Relationships between peak-to-peak amplitudes (P1-N1) and IPIs for three levels of current pulse intensities. The intensities were 0.18, 0.24, and 0.30 mA, and are denoted by circles, triangles, and squares, respectively.
