
Figure 5. Upregulation of Eomes in CD8+ T cells of melanoma-bearing mice by the treatment with ALK5 inhibitors and T-cell-specific Smad4 deletion.
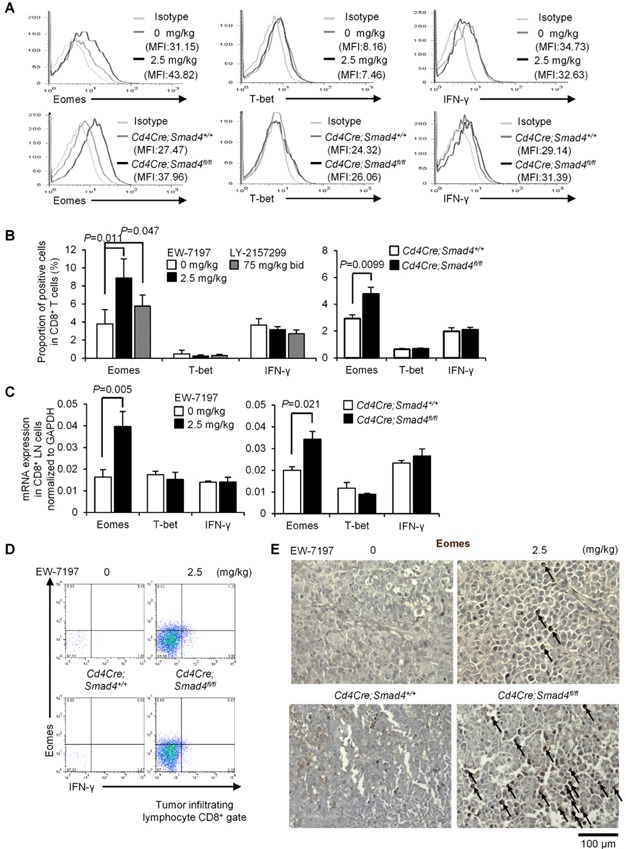
Data are shown as mean + SEM. P values were calculated by 2-tailed unpaired Student's t-test.
- Representative histograms show Eomes, T-bet and IFN-γ expression in CD8+ dLN cells with MFI.
- Graphs show the % of positive cells in CD8+ dLN cells of EW-7197 (n = 10) or LY-2157299 (n = 5) treated or Cd4Cre;Smad4+/+ and Cd4Cre;Smad4fl/fl (n = 10/genotype) melanoma-bearing mice.
- qPCR analyses for mRNA levels in CD8+ dLN cells (n = 5/group, n = 5/genotype).
- Representative Eomes/IFN-γ dot plots of CD8+ gated TILs. Graphs show the % of positive cells in the Ficoll-enriched cells (n = 8/group, n = 5/genotype).
- Representative immunohisochemistry sections of inoculated melanomas (scale bar: 100 μm). Arrows indicate Eomes+ cells.