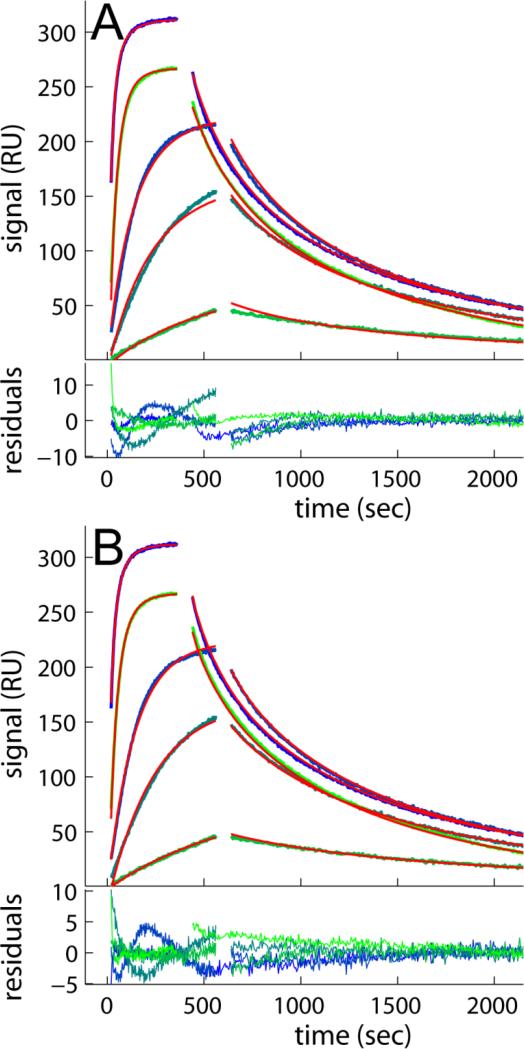
Figure 3.
Mass transport limited binding of B2MG at 1.0, 5.0, 10, 50 and 100 nM binding to CM5 sensor chip with 6000 RU of anti-B2MG-biotin. The effects of mass transport limitation on the binding progress data are highlighted in comparison of the best-fit distribution model not accounting (A) or accounting for mass transport limitation in a two-compartment approximation (B). Experimental traces are lines colored in blue to green, fits are the solid red lines, and residuals are shown in the bottom of each panel, with rmsd of 2.26 RU and 1.59 RU, for A and B, respectively.

