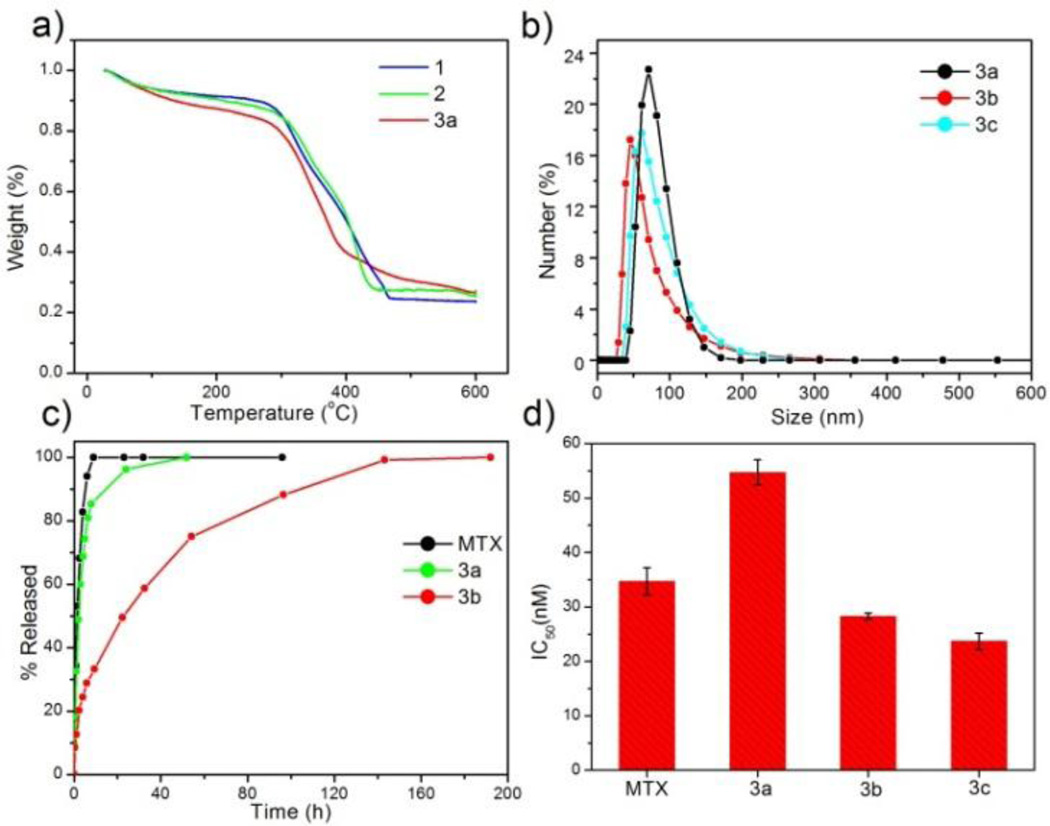
Figure 2.
a) TGA curves for 1, 2, and 3a. b) Particle size distributions for 3a, 3b, and 3c obtained by DLS. c) Release profiles in PBS for free MTX, 3a, and 3b obtained by measuring the release of MTX by UV-Vis spectroscopy. d) IC50 values for free MTX, 3a, 3b, and 3c obtained from in vitro cytotoxicity assays with a range of MTX concentrations against Jurkat human ALL cells. Error bars represent one standard deviation.

