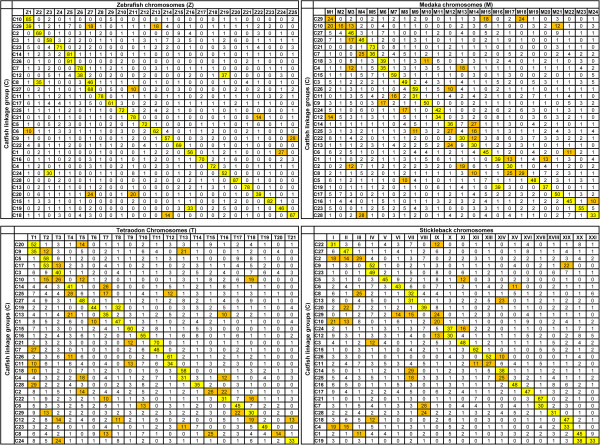
Figure 2.
Homologous chromosome relationships between catfish and four model fish species. In each case, the catfish linkage group (LG) are displayed in rows, and the model fish species (zebrafish, medaka, stickleback, Tetraodon) chromosomes are displayed in columns. The Numbers in the cell is the percentage of homologous genes between catfish and other model fish species located on this chromosome (LG). Percentage higher than 30% is highlighted with yellow color, while percentage lower than 30% but higher than 10% is highlighted with orange color.

