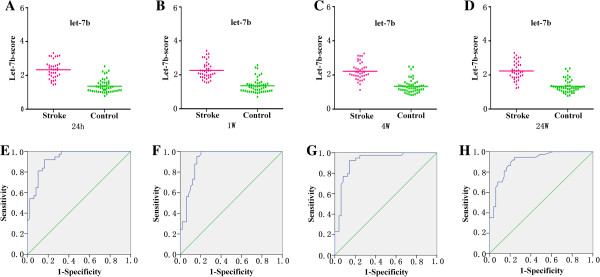
Figure 6.

Discrimination between ischemic stroke and control group at 24 h, 1 w, 4 w, 24 w using the composite miRNA score (let-7b-score). (A-D) The composite let-7b-score was shown as median values in different groups. (E-H) ROC curve analyzed the diagnostic value of the composite miRNA-score.
