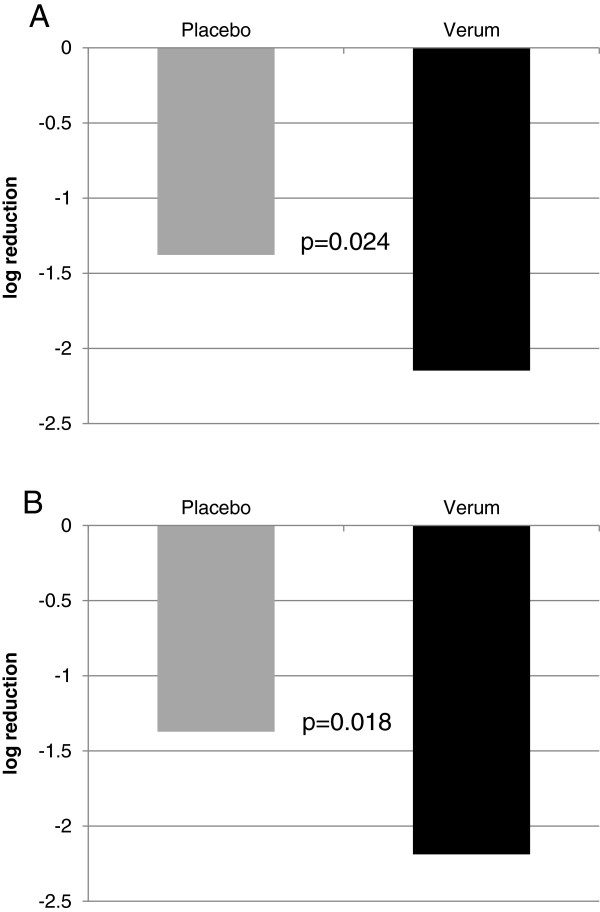
Figure 4.
Differences in viral load between days 1 and 3/4. The median log10 difference of the viral load between days 1 and days 3 or 4 determined with quantitative real time PCR for a set of respiratory viruses as described in the materials and methods is shown. The titers were compared by applying a Median-test. A: ITT-VP p = 0.024; B: PP-VP: p = 0.018. The black bar shows Iota-Carrageenan and the grey bar shows placebo.

