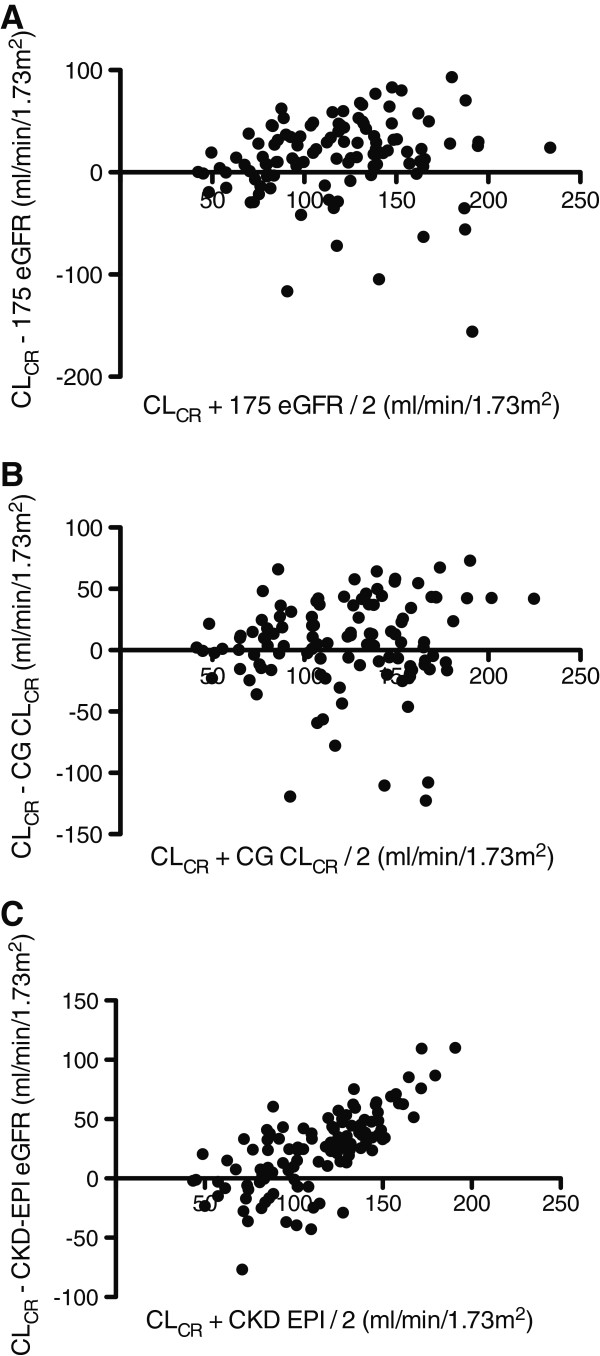
Figure 2.
Bland-Altman plots of CLCR versus mathematical estimates in all patients. Comparison of the difference between CLCR and 175 eGFR (panel A), CG CLCR (panel B), and CKD-EPI eGFR (panel C) on the y-axis, versus the average value obtained on the x-axis. CLCR = 8-hr Creatinine Clearance, 175 eGFR = Abbreviated Modification of Diet in Renal Disease 175 formula, CG CLCR = Cockcroft-Gault Creatinine Clearance, CKD-EPI eGFR = Chronic Kidney Disease Epidemiology Collaboration Equation.

