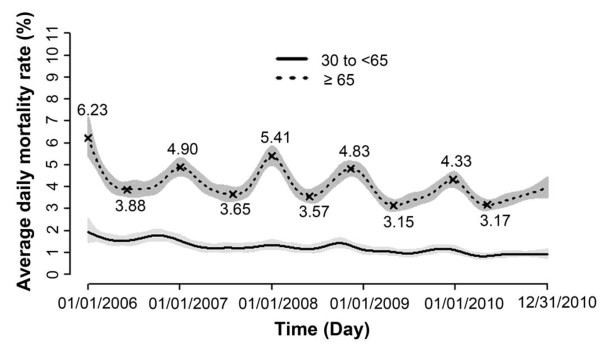
Figure 1.

Temporal trends of mortality rates for older (dotted line) and younger (solid line) inpatients with cardiovascular diseases (I00-I99) from 32 hospitals in Beijing, China. The shades indicated the 95% confidence intervals. The highest and lowest mortality rate within each year were annotated above/below the dotted line. Average daily mortality rates were estimated as predictive values from the generalized additive model.
