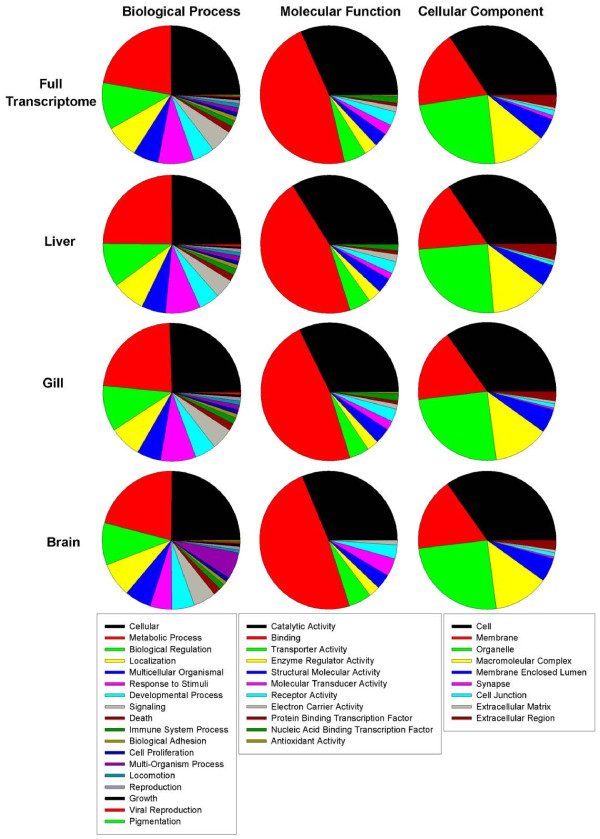
Figure 3.
Tissue specific GO comparison. Unigenes expressed in at least one treatment were included in the gene ontology analysis. GO terms were determined using BLAST2GO [40] with an e-value cut off of 10-5, a minimum sequence filter of 25, and sorted based on level 2 GO classifications. Any GO term that met the filter for the minimum number of sequences to include as a node (n = 25) was included in the comparison.

