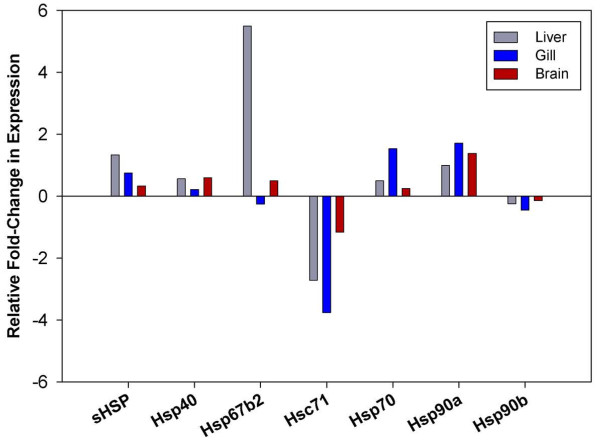
Figure 5.
Differential expression of Heat Shock Protein families in T. bernacchii. Relative fold-change in expression of annotated HSPs in +4°C acclimated fish compared to control fish were obtained from the RNAseq analysis and directly compared across liver (grey), gill (blue) and brain (red). HSPs were grouped by gene family and the relative fold-change computed by averaging the change in expression of gene family constituents.

