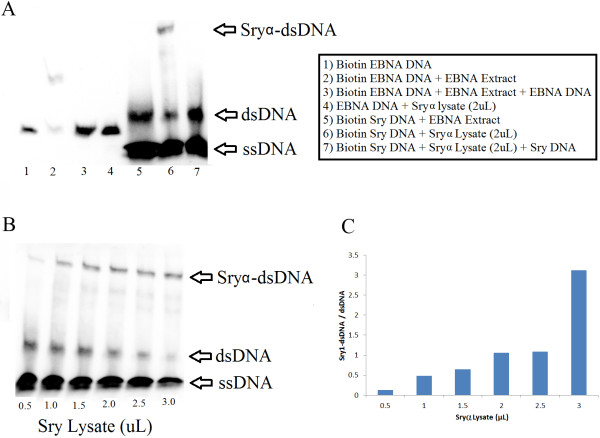
Figure 6.
Binding of Sryα to a known Sry-DNA binding element. A) Control experiments for Sryα specific binding. The protein and DNA identities for each lane can be seen in the box next to the gel. B) Concentration curve for extract amounts of Sry1 transformed E. coli cell lysates expressing Sryα protein. C) Densitometry measurements of the Sryα-dsDNA and dsDNA bands mapped relative to lysate volume.

