
Figure 2.
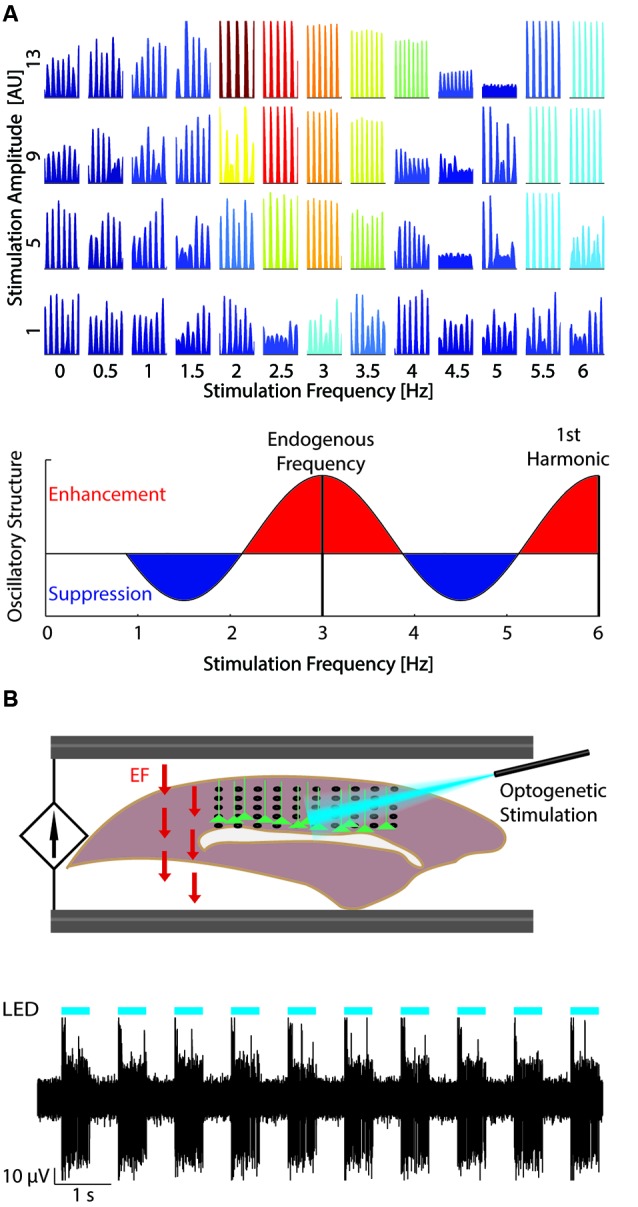
Studying resonance dynamics with large-scale computational models and optogenetics. (A) Top: Network response to varying stimulation amplitude (increasing bottom to top) and frequency (left to right). Color indicates power of network activity at the stimulation frequency. At low stimulation amplitudes, the network was most entrained by stimulation at the endogenous frequency (~3 Hz). Increased stimulation amplitude expanded the stimulation frequencies that entrained the network. Reprinted with permission (Ali et al., 2013). Bottom: Change in oscillatory structure for increasing tACS frequency. Red areas represent relative enhancement of oscillatory structure with maxima at the endogenous oscillation frequency and harmonics of the endogenous oscillation. Blue areas represent relative suppression with minima between harmonics of the endogenous oscillation. (B) Top: Experimental set-up (Schmidt et al., 2013). Optogenetic stimulation (blue) is applied to layer V pyramidal cells (green) from above to entrain the network at the desired frequency. EF (field arrows, red) is then applied through AgCl wires to model the effect of TCS. Neural data may then be recorded, for example with a multielectrode array pictured here (black). Bottom: Example multiunit trace (black) displaying strong entrainment to the optogenetic stimulation (cyan). Reprinted with permission (Schmidt et al., 2013).