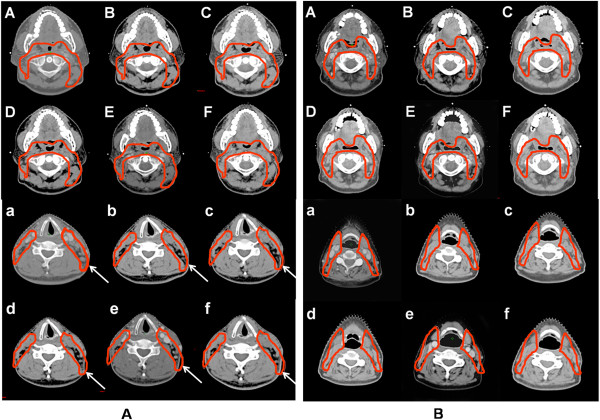
Figure 3.
Comparison of the anatomical structure changes in an overweight patient and a normal BMI patient. (A): a patient with BMI = 26.5; (B): a patient with BMI = 19.7. The arrows show the obvious anatomical structure changes during CRT on cervical slices. The upper and the lower panels show representive oropharyngeal and cervical slices at different time points from week 0 to week 5, respectively. BMI: body mass index; CTV: clinical target volume; CRT: chemoradiotherapy.

