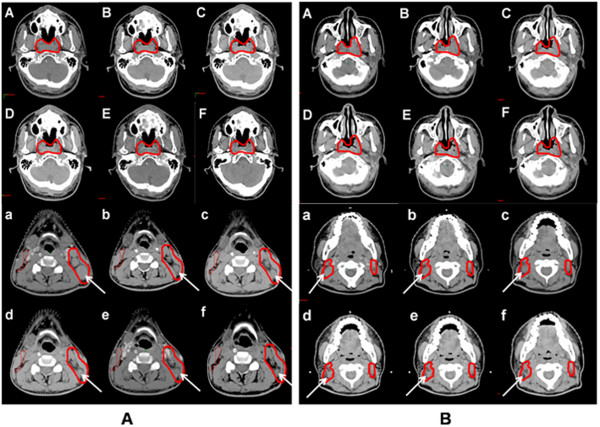
Figure 4.
Comparison of GTV shrinkage in two patients with different tumor ADC. (A): a patient with a tumor ADC of 0.7 × 10⁻³ mm/s; (B) a patient with an ADC of 0.89 × 10⁻³ mm/s. The arrows indicate cervical lymph node shrinkage in the patients during CRT. The upper and the lower panels show representive primary tumor and cervical lymph node slices at different time points from week 0 to week 5, respectively. GTV: gross target volume; ADC: apparent diffusion coefficient; CRT: chemoradiotherapy.

