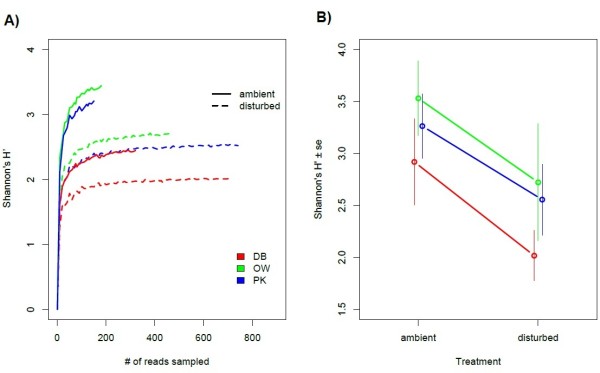
Figure 2.

Bacterial diversity (Shannon’s H’) of oyster gill microbiota stemming from different oyster beds. A) Rarefaction curves of Shannon’s H’ in different oyster beds under ambient field conditions and after disturbance. Shown are rarefied means for treatment and origin groups from 10 resamples with a maximum number corresponding to the lowest coverage of a single microbiome in each group. Solid lines represent ambient conditions and dashed lines disturbed microbial communities. B) Observed values of Shannon’s H’ for individual oysters stemming from different oyster beds (mean ± se) showing significant differences between oyster beds (F2,36 = 3.55, P = 0.039) and a significant decrease of diversity after disturbance (F1,36 = 7.52, P = 0.009).
