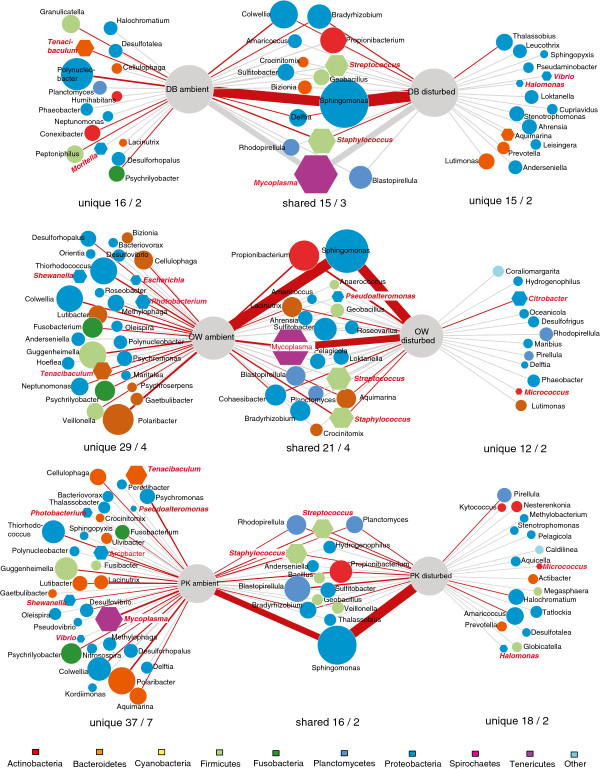
Figure 4.
Association network of bacterial taxa (genus level) in ambient and disturbance treatments of the three different oyster beds (DB, OW, PK). Taxa are shown as circles with colour-coded phylogenetic relationship and size reflecting overall relative abundance (ln(x + 1) transformed) from a rarefied resampled data set. Lines indicate the occurrence in the respective treatment. Hence, taxa only related to one treatment occurred exclusively in either ambient or disturbed oysters while taxa related to both treatments occurred before and after the disturbance. Width of lines corresponds to the proportion of each taxon within each treatment. Red edges indicate significant distribution bias towards one treatment group. Hexagons represent genera known to contain pathogenic strains (printed in bold) and numbers below each group give the number of genera followed by the number of potential pathogens.

