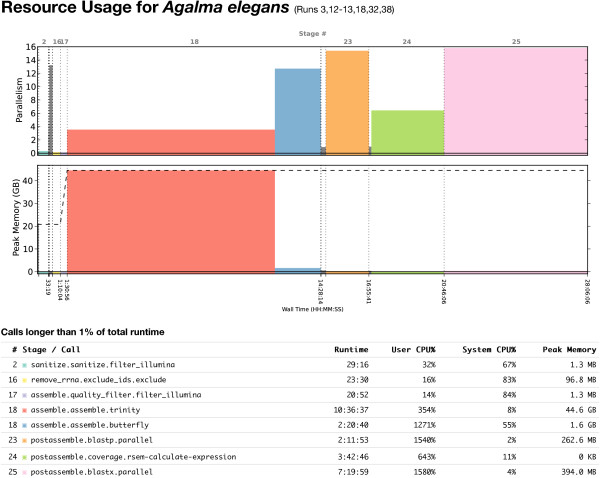
Figure 4.
A profile of computational resource utilization for thetranscriptome pipeline. This plot is from the report for the Agalma elegans assembly. Although annotation of transcripts (the calls to blastx and blastp during the postasemble stage) showed the highest processing time (top row), assembly (the call to Trinity during the assemble stage) displayed the highest memory use and it took the longest real time to finish (bottom row).

