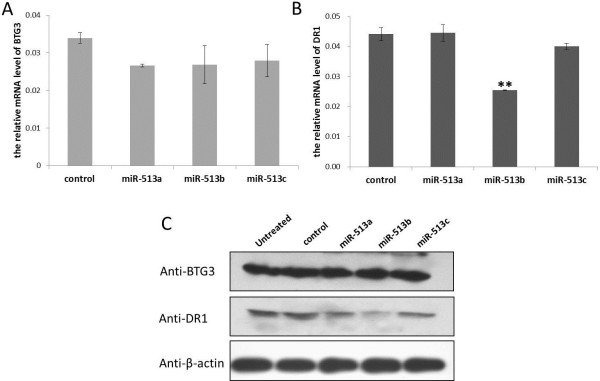
Figure 6.

Significantly decreased expression of DR1 both at the mRNA and protein levels by MiR-513b. (A) mRNA levels of BTG3 in transfected HeLa cells by real-time qPCR. (B) mRNA levels of DR1 in transfected HeLa cells by real-time qPCR. (C) protein levels of BTG3 and DR1 in transfected HeLa cells via western blotting. β-actin was used as the internal control gene. “untreated” represents untransfected cells. “control” represents cells transfected by negative control miRNA. Error bar represents standard deviation (n = 3). ** P < 0.01 (two-tailed student’s t-test).
