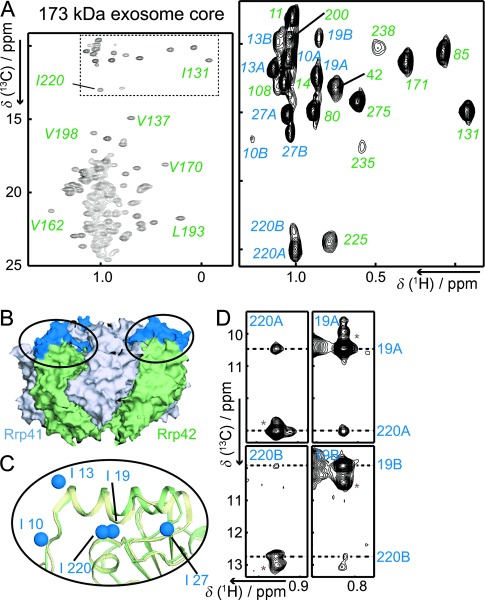
Figure 1.

A) Methyl TROSY spectrum of the 173 kDa exosome core that contains NMR-active Rrp42. The boxed Ile-δ1 region is enlarged and residues that show two sets of peaks are labeled “A” and “B”. B) The region that adopts two conformations is colored blue on the surface of the exosome core. This region is part of the cap-binding interface (see also Figure S1). C) Enlargement of the indicated region in (B), where Rrp42 as found in the exosome core (green; PDB: 2BR2) is superimposed on Rrp42 and as found in the exosome-Rrp4 complex (olive; PDB: 2JE6). The helix in the Rrp42 cap-binding region adopts a different conformation upon interaction with the Rrp4 cap. The blue spheres show the positions of the exchanging Ile residues. Note the short distance between Ile 19 and Ile 220. D) Planes from a 3D (H)-C-C-H NOESY spectrum that displays interproton NOE contacts between Ile 19 and Ile 220 in both states, indicating that the structures of state A and state B in the free exosome complex are similar. Cross peaks indicated with a red asterisk result from chemical exchange between the two states (see Figure 2).
