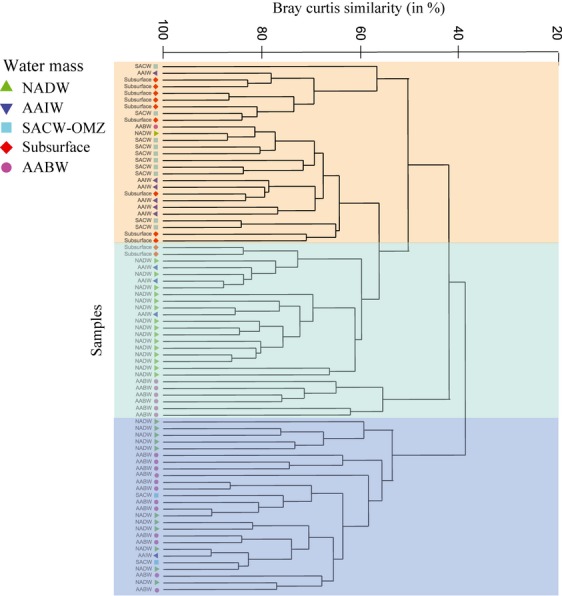
Figure 4.

Clustering of samples from different depths based on Bray–Curtis similarity matrix obtained by T-RFLP fingerprinting of bacterial communities. Different symbols denote water masses. For water mass abbreviations see Table 1.

Clustering of samples from different depths based on Bray–Curtis similarity matrix obtained by T-RFLP fingerprinting of bacterial communities. Different symbols denote water masses. For water mass abbreviations see Table 1.