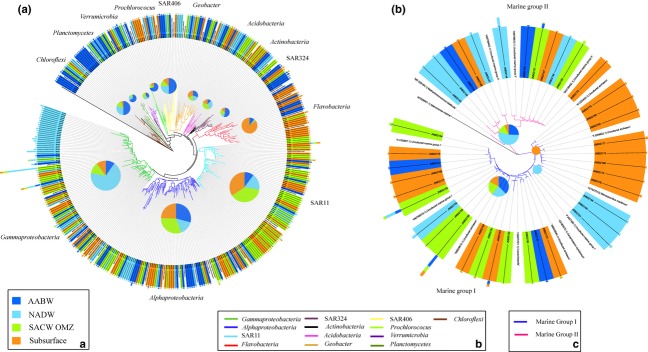
Figure 6.

Neighbor-joining phylogenetic tree based on 16S rRNA gene analyses of Bacteria (a) and Archaea (b) obtained at a central station (St. 12) in the Romanche Fracture Zone. Only one representative of OTU sharing ≥ 98% identity is shown. Bars show the number of clones represented by each sequence. Four water masses are indicated by color code (a) and the proportions of clones from each depth represented in the different clusters are indicated in the pie charts. Phyla are distinguished by color of the branch in the phylogenetic tree of the Bacteria (see b) and Archaea (see c).
