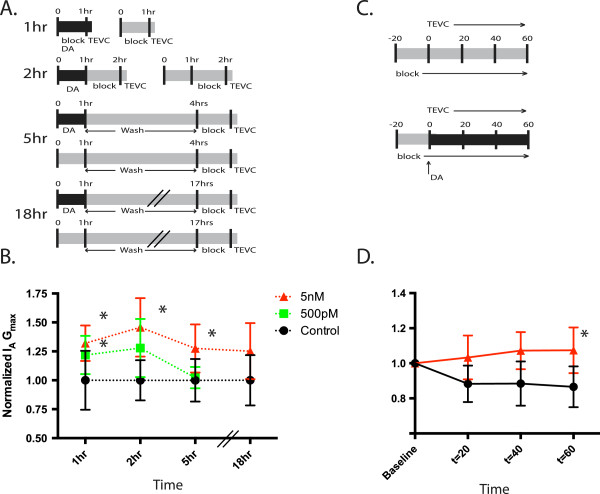
Figure 2.
IA regulation by DA is both time and dose dependent. A. Experimental design: After identification, 1 hr, 2 hr, 5 hr and 18 hr experiments were performed as diagramed. Experiments were concluded after TEVC measurement of IA. B. Each experiment was normalized by the mean for the control group and normalized measures of LP IA were plotted over time for the experiments diagramed in 2A. Data points represent normalized IA Gmax for each treatment group ± S.D. Each treatment group is independent. Asterisks indicate significant differences from control, Dunnet’s post hoc test, p < 0.05 (see text). Dashed lines indicates the within treatment trend overtime. X-axis not drawn to scale. C. In these experiments IA was measured repeatedly throughout a 1 hr DA or saline application, as diagramed. After an initial application of blocking saline, IA was measured every 20 min in the presence or absence of DA. D. For each individual experiment in 2C, the values were normalized to t = 0. Normalized means ± S.D. for each time point are shown. Asterisks represent significant differences between treatments determined by post-hoc analysis, p < 0.05.

