Figure 6.

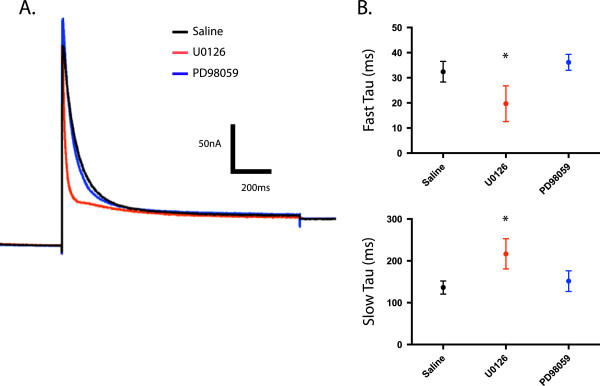
U0126 alters the time constants of inactivation. A. Representative two-electrode voltage clamp IA recordings for Saline, U0126, PD98059 treatment groups. Overlaid traces are leak-subtracted currents elicited by a step to +20 mV after a -90 mV prepulse. B. Kinetics of IA inactivation were determined by fitting the +20 mV current traces with a double exponential function. The mean fast (top panel) and slow (bottom panel) time constants (τ) of inactivation were plotted ± S.D for Saline, U0126, and PD98059 treatment groups. Data from drug alone and drug with 5 nM DA samples were pooled, as both means and variance between two groups were not different (n ≥ 10 for each group). Asterisks indicate significant differences from control (saline). Both the fast and slow τ values for U0126 were significantly different than PD98059 or Saline. Saline and PD98059 were not significantly different. Data were analyzed with ANOVAs and Tukey’s post hoc tests.
