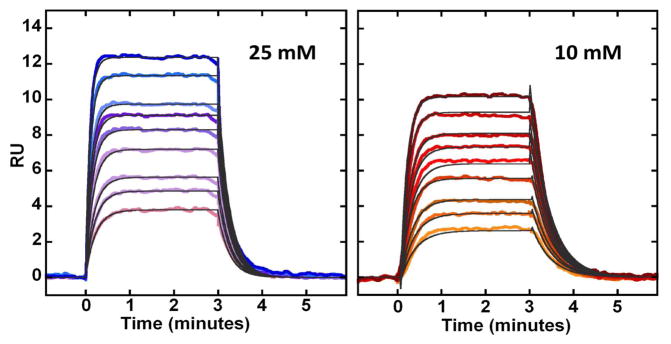
Figure 3.

SPR sensorgrams for the interaction of Fe(III)•BLM B2 with DNA 2 at 25 mM (left panel) and 10 mM (right panel) NaCl concentrations and 25 °C. The individual sensorgrams (colored) represent responses at BLM B2 concentrations of 50, 75, 100, 150, 200, 250, 300, 400 and 500 nM (bottom to top). Global kinetic fit (black solid lines) with a 1:1 model was performed using Biacore T200 Evaluation Software to obtain kinetic association and dissociation rate constants.
