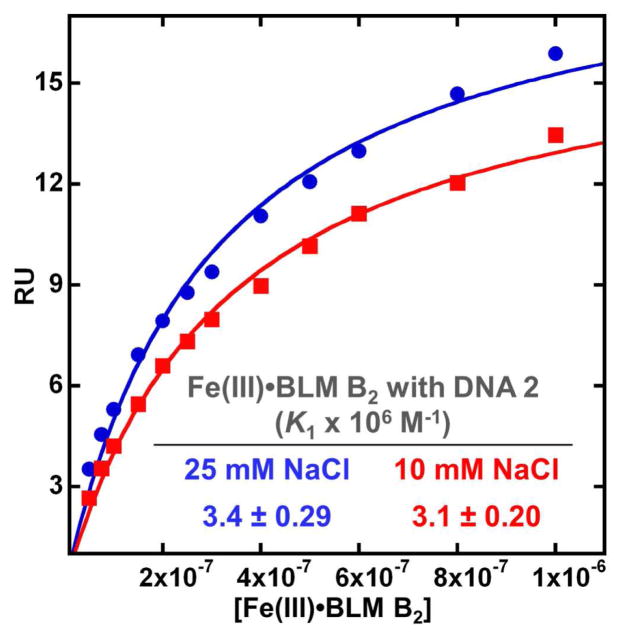
Figure 4.
SPR equilibrium binding plots of Fe(III)•BLM B2 with DNA 2 at 10 mM and 25 mM NaCl concentrations and 25 °C. The steady-state response values were fitted as a function of free ligand concentration to a single-site interaction model. The binding affinities are listed in the inset and in Table 1.

