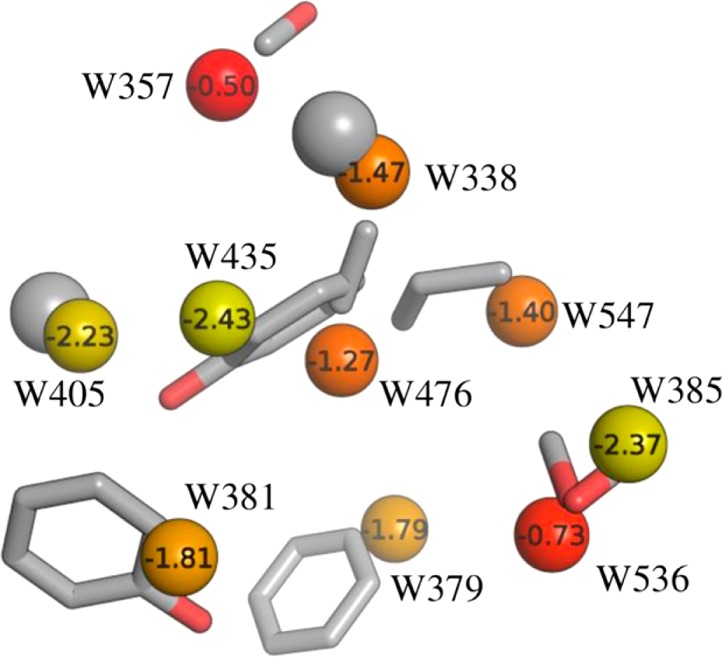
Figure 5.

A subset of crystallographic water molecules in the Hsp90 binding site, labeled with the IFST-based solvation free energies in kcal/mol and colored from yellow to red representing low to high solvation free energy. The corresponding MCSS-derived probe positions overlaid for each site. The most favorable probe molecules based on MM-GBSA scores are shown.
