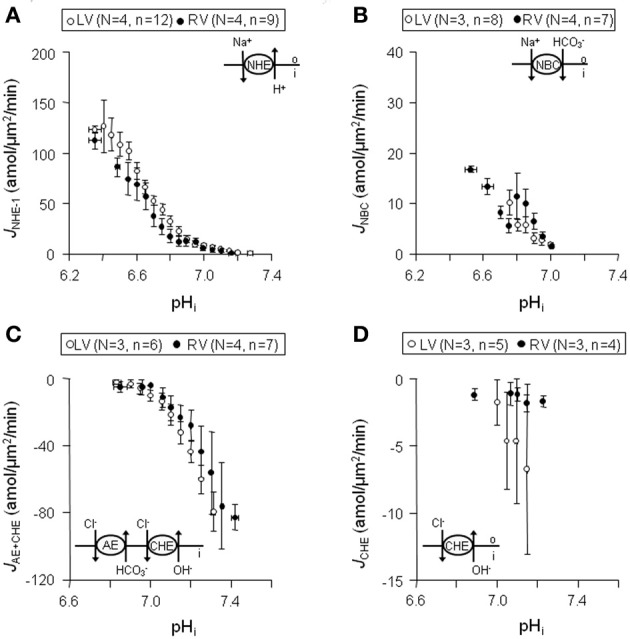
Figure 4.

Sarcolemmal J+H through NHE-1, NBC, CHE + AE, and CHE in normal left and right ventricular myocytes. Data obtained from left are shown in blank circles, whereas from right are indicated with filled circles. Panels (A–D) illustrates that sarcolemmal JNHE-1 (A), JNBC (B),JAE + CHE (C), and JCHE (D) are not significantly different throughout the whole pHi range in left compared to right ventricular myocytes.
