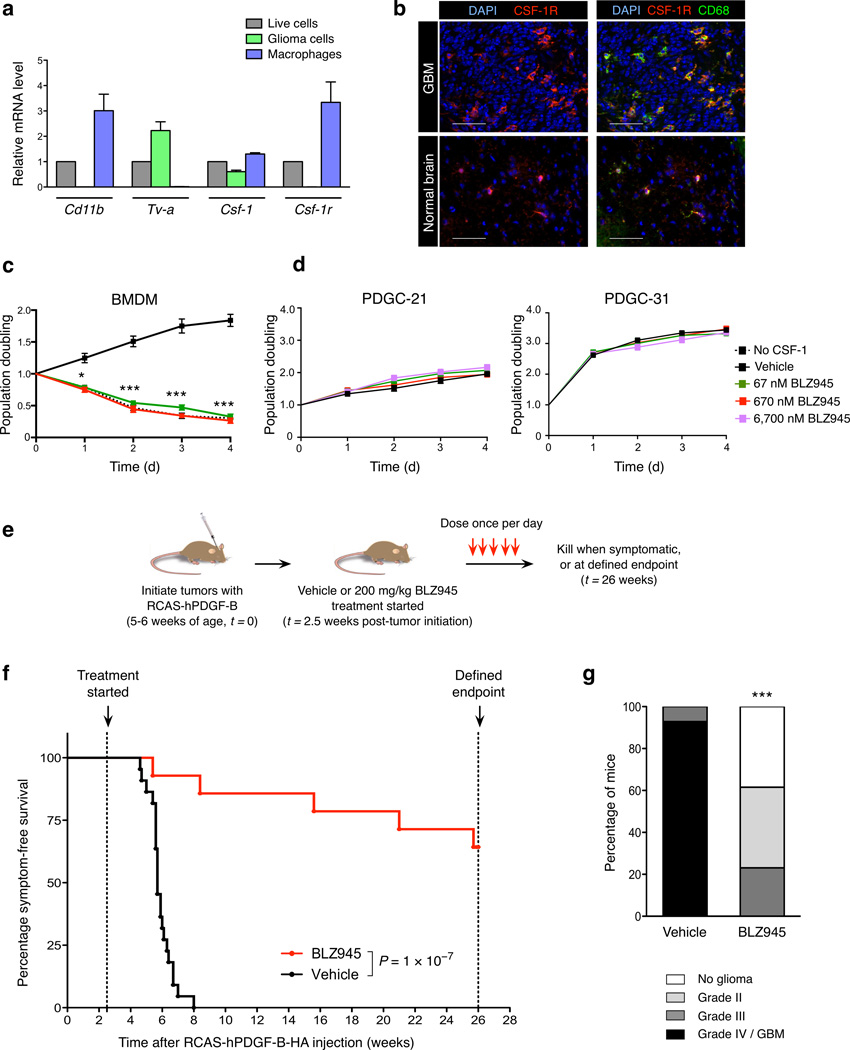
Figure 1. CSF-1R inhibition specifically targets macrophages, improves survival and decreases glioma malignancy in the transgenic PDG model.
(a) Expression of Csf-1 and Csf-1r in different cell populations from PDG-GFP gliomas: mixed population of live cells (DAPI−), purified glioma cells (GFP+) and macrophages (CD11b+Gr-1−). Cd11b and Tv-a were used as cell type-specific control genes for macrophages and glioma cells respectively. Expression is depicted relative to the live cell fraction, normalized to Ubc for each sample (n = 3). (b) Representative immunofluorescence images of normal brain or PDG GBM co-stained with CSF-1R, CD68 (macrophages/microglia), and DAPI. Scale bar, 50 µm. (c) Graph showing the CSF-1R inhibitor BLZ945 blocked BMDM survival, with a comparable effect to CSF-1 deprivation, assessed by MTT assays; n = 13 independent replicates. (d) Graph showing MTT assays of BLZ945 treatment of independent PDGF-driven glioma cell (PDGC) primary lines derived from PDG mice (see also Supplementary Figs. 3d, 7c). Concentrations up to 6,700 nM BLZ945 (100× the dose required to effectively kill BMDMs in vitro) had no effect on glioma cell survival or proliferation, n = 3 independent replicates. (e) Experimental design for long-term survival trial: PDG mice were injected with RCAS-hPDGF-B-HA between 5–6 weeks of age to induce glioma formation, and randomly assigned to vehicle (20% captisol, n = 22) or BLZ945 (200 mg.kg–1, n = 14) treatment groups at 2.5 weeks post-injection. Mice were dosed once daily until they developed symptoms or reached the trial endpoint, and (f) symptom-free survival curves generated. (g) Vehicle and BLZ945 groups were graded histologically (n = 14, 13 respectively). Graphs show mean and s.e.m. in (a, c–d). P values were obtained using unpaired two-tailed Student’s t-test in (c–d), Log Rank (Mantel-Cox) test in (f), and Fisher’s exact test in (g). *P<0.05, ***P<0.001.

