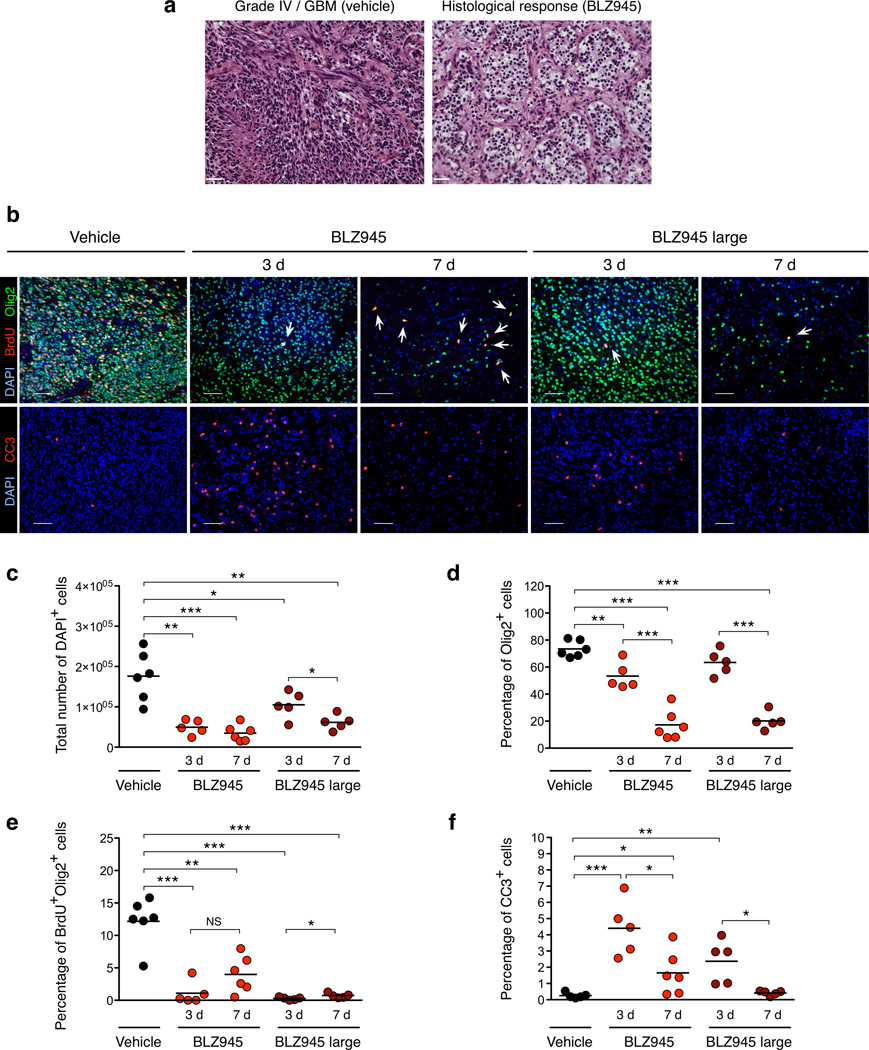
Figure 3. Short-term BLZ945 treatment results in reduced tumor grade and proliferation, and increased apoptosis.
(a) Representative H&E images from 7d trial in the PDG model depicting grade IV/GBM (vehicle) and histological response (BLZ945). (b) Representative images from 3d and 7d timepoints stained for Olig2 (glioma cells), BrdU, cleaved caspase-3 (CC3), and DAPI. White arrows indicate rare BrdU+Olig2+ cells in BLZ945 groups. (c) Quantitation of total DAPI+ cells per tumor; (d) percentage of Olig2+ cells relative to total DAPI+ cells; (e) percentage of proliferating BrdU+Olig2+ cells relative to total DAPI+ cells; and (f) percentage of apoptotic CC3+ cells relative to total DAPI+ cells (n ≥ 5 per group). These analyses revealed a progressive reduction in cell number, and by 7d, average glioma cell density was reduced to ≤ 20% of total cells in both BLZ945 groups. Analysis of glioma cell proliferation revealed a 67–98% reduction following BLZ945 treatment. Circles represent individual mice and horizontal lines represent the mean. Scale bar, 50 µm. P values were obtained using unpaired two-tailed Student’s t-test; NS=not significant, *P<0.05, **P<0.01, ***P<0.001.

