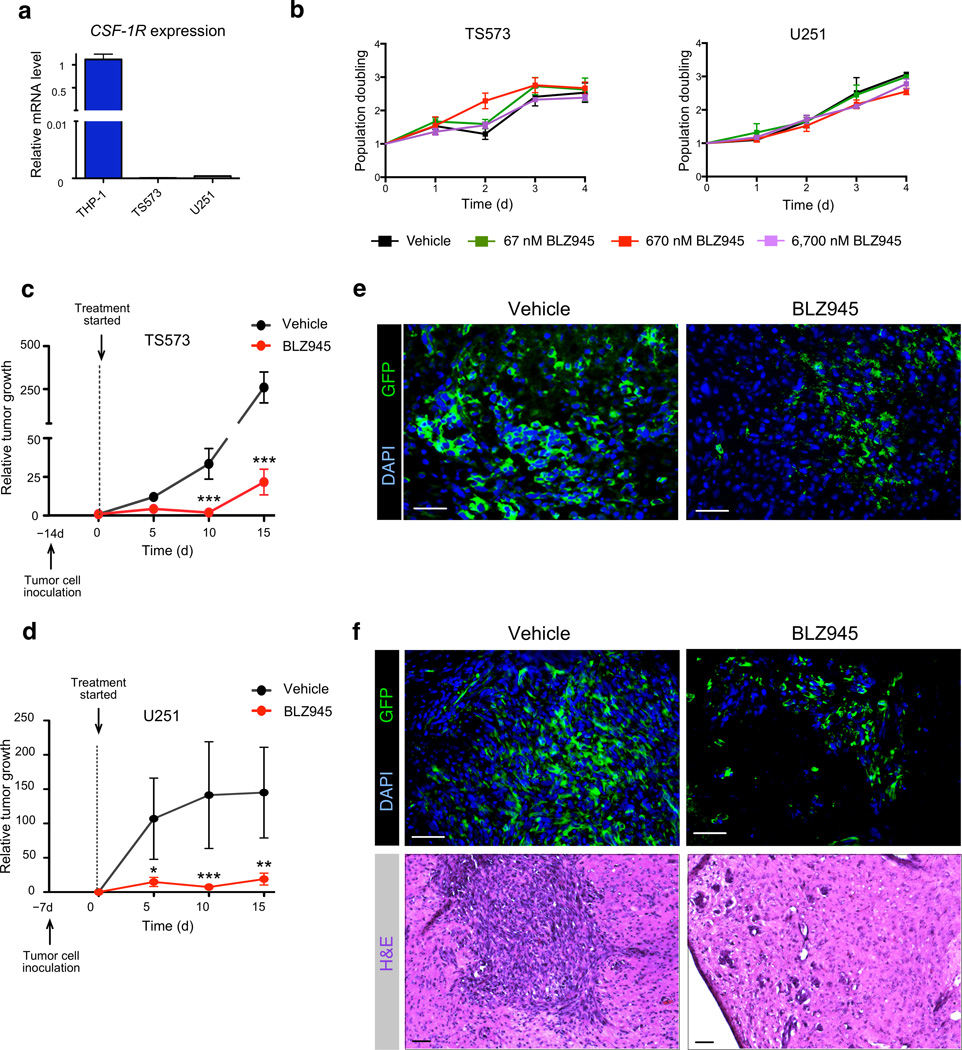
Figure 4. BLZ945 inhibits orthotopic tumor growth of patient-derived proneural tumor spheres and cell lines in vivo.
(a) Graph shows assessment of CSF-1R mRNA expression in human proneural tumor sphere cells, TS573, and in the human proneural cell line, U251, compared to the human macrophage line THP-1 (positive control). Expression is normalized to β2M for each sample, n = 3 independent replicates. (b) Graph showing MTT assays of BLZ945 tested against TS573 and U251 human glioma cells, demonstrating no effect of BLZ945 concentrations up to 6,700 nM. n = 3 independent replicates. (c, d) Graphs showing relative tumor growth determined by bioluminescence imaging (BLI) output in NOD/SCID mice intracranially injected with (c) 5 × 10⁴ TS573 cells or (d) 2.5 × 10⁵ U251 cells. Treatment with BLZ945 was initiated when tumors were in a positive growth phase determined by BLI, which corresponded to d14 for TS573 and d7 for U251. Mice were randomly assigned to vehicle (n = 12 for TS573, n = 16 for U251) or BLZ945 (n = 11 for TS573, n = 17 for U251) treatment groups. Tumor growth was evaluated every 5d for 15d, at which point vehicle-treated mice became symptomatic and both cohorts were sacrificed for further analyses. (e, f) Representative images of vehicle-treated and BLZ945-treated (e) TS573 and (f) U251 xenograft tumors described in (c, d), stained for GFP (tumor cells) and DAPI. Representative H&E images of both treatment groups for U251 xenografts are shown in the lower panels. Scale bar, 50 µm. Graphs represent mean and s.e.m. P values were obtained using nonparametric two-tailed Mann Whitney test; *P<0.05, **P<0.01, ***P<0.001.

